Wall Street's performance on Friday is impressive considering that oil almost by US$2.37 to US$62.91 per/barrel. Wall Street shows resilient to high oil price (at least up to US$70 per/barrel)
I think the world markets is fed up to be held ransom by high oil. Disruption of supply, terrorist attack on oil installation, kid-nap by leftist rebels, the list goes on.
It is gratifying to see the world markets take in stride such negativity and focus on the the fundamentals. America had a good 2005 and looking forward to a good 2006. They are expected to revised their GDP numbers and it will certainly give a leg up to Wall Street.
Wall Street Closing Numbers
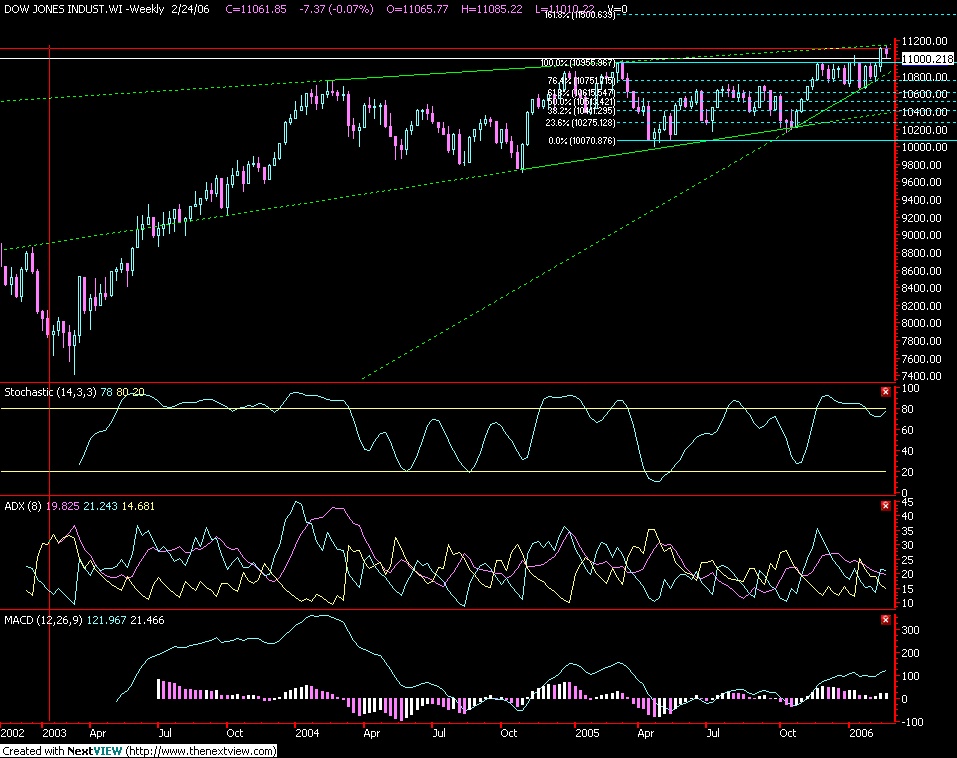
Dow Jones
Close: 11,061.85 Change: -7.37 -0.07%
Open: 11,065
High: 11,085
Low: 11,010
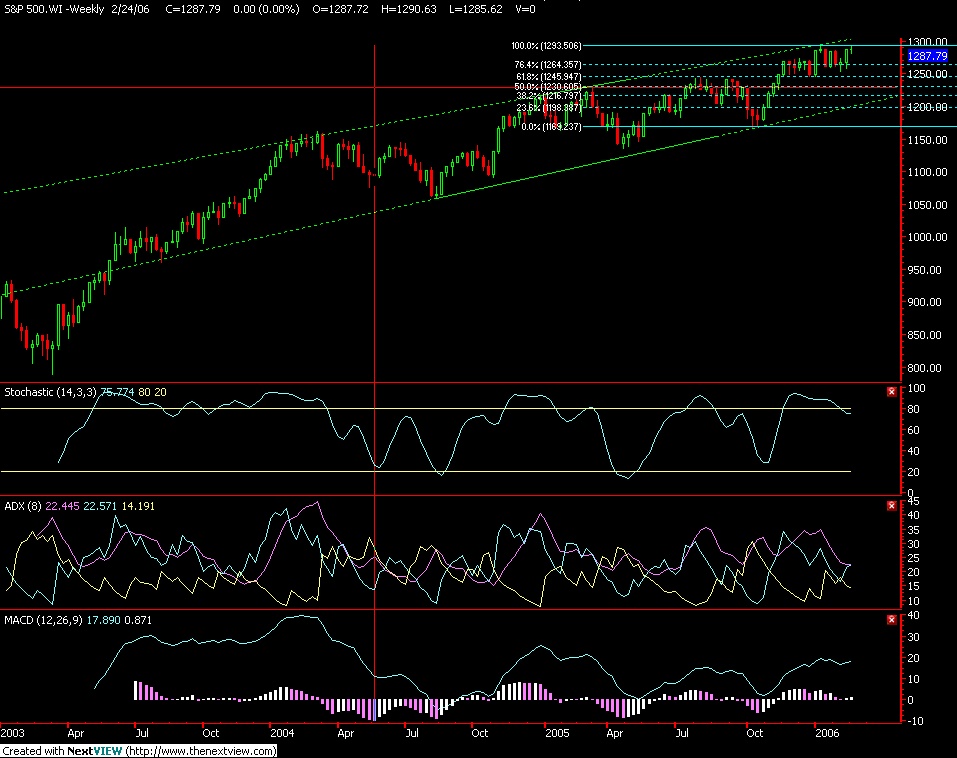
S&P500
Close: 1,289.43 Change: +1.64 +0.13%
Open: 1,288
High: 1,290
Low: 1,286
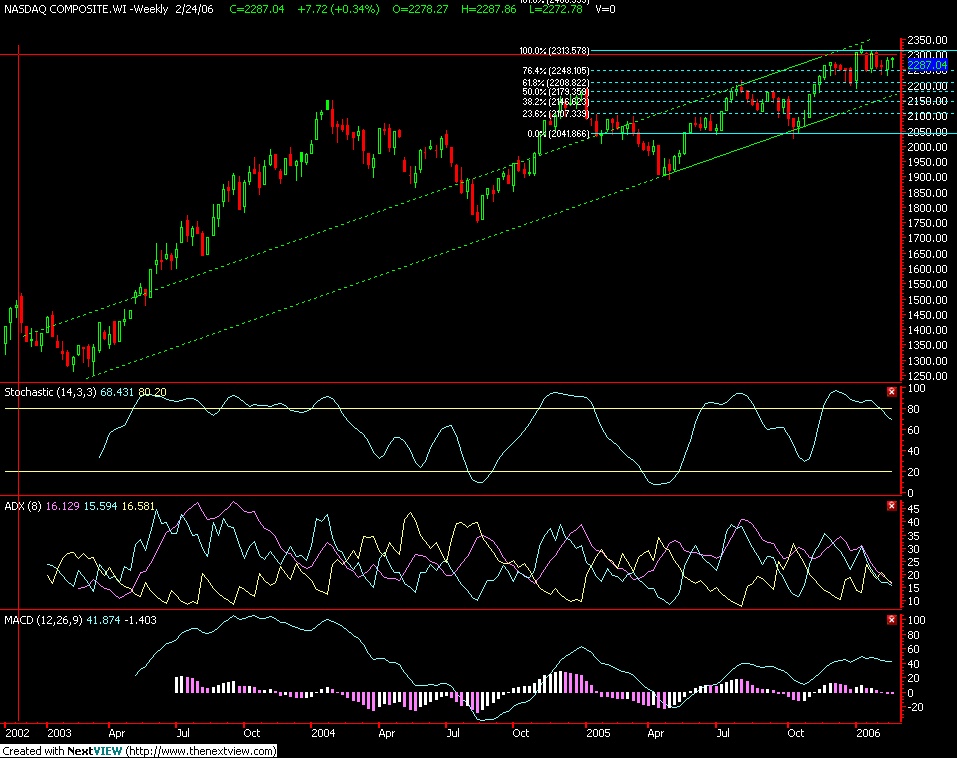
Nasdaq
Close: 2,287.04 Change: +7.72 +0.34%
Open: 2,278
High: 2,288
Low: 2,273