STI - More Up Side?
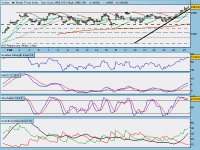
 STI Daily
Looking at the daily charts, STI is touching the upper band of the Bollinger. RSI, MACD and STO all looks very strong for a push up tomorrow. Likely to test 2500 soon(days to weeks). The possible rise today could be attributed to the Feb SiMSCI futures contract expiring today and traders have to square off their positions. There is also word that those who shorted the SiMSCI will be hard press to cover their shorts today thus the big jump in the SiMSCI today.
I am almost certain that we will see a higher opening tommorow (unless Wall Street has a poor perfomance) It is also good to note that all major global indicies are at their highs. Likelyhood for profit taking before the next run up is remotely possible soon.
I can see from SI forum there are people with contrarian views starting to emerge. There is one commment about selling into strength. I would like to see the STI break new highs weekly however, the contrarian part of me always think otherwise.
 STI - Hourly Charts
STI gapped up to 2462.22 this morning, it was strugging to find its direction thru out the morning session and at around 1200hrs, from +3 pts the STI push itself up to +10 pts at the lunch break. If the STI follows the trendline, we are likely to see a higher close today.
SiMSCI (Feb 06 290.8) (Mar 06 291.4) is also at a high, lets see if the spot market will play catch up with the futures. Have a profitable week.

0 Comments:
Post a Comment
Subscribe to Post Comments [Atom]
<< Home